In this section, users can access reports of Exercises assigned to students. The reports are grouped according to how they were assigned, either by Class or Peer group. For example, if an Exercise was assigned to multiple classes, the records will be grouped by Class. However, if students from different Classes are assigned to the same peer groups, then the records will be grouped by Peer Group, as well as by Class.
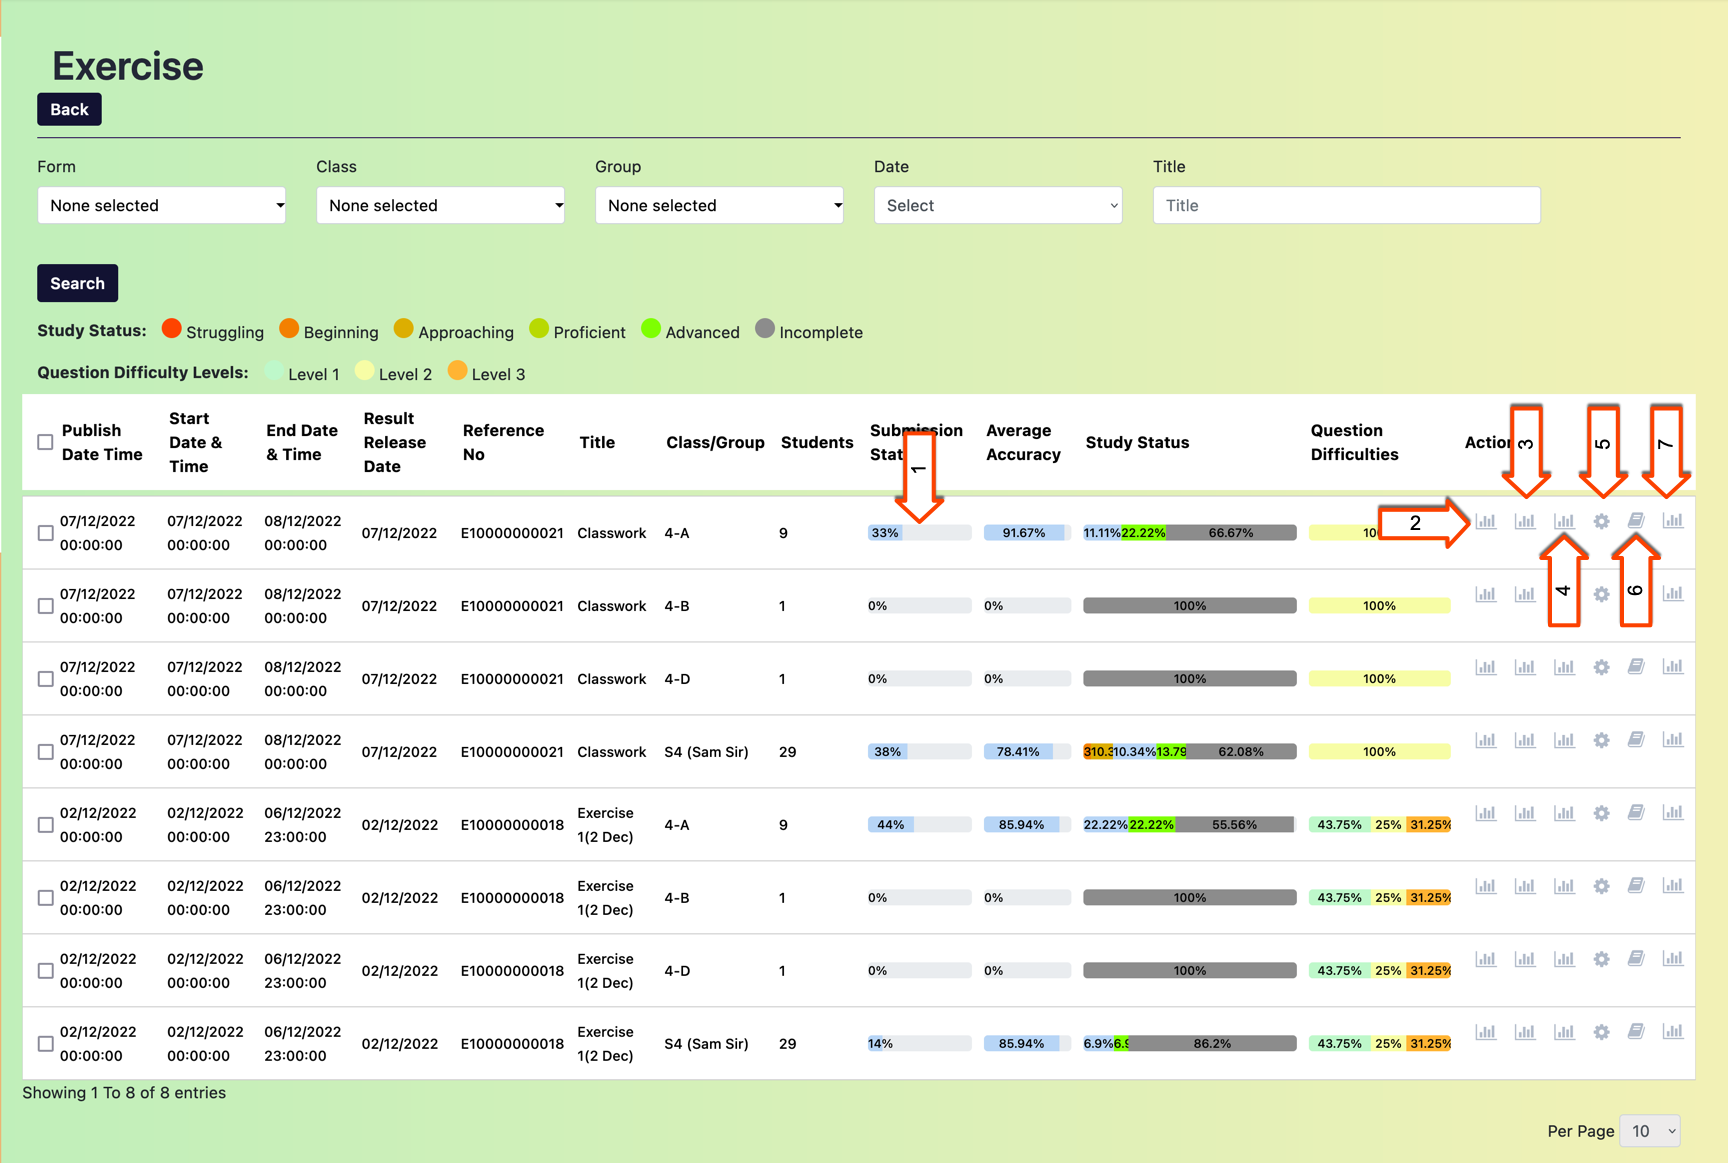
The reports available include:
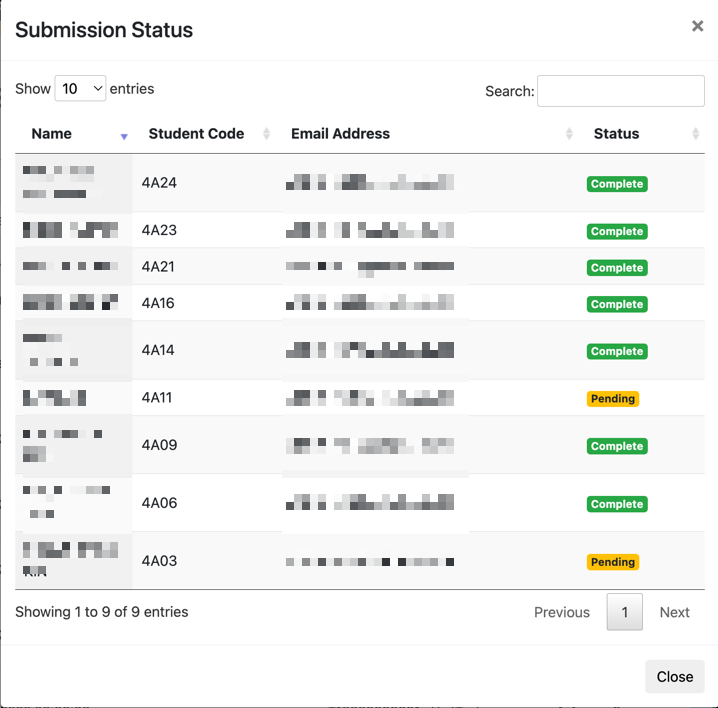
| 1 | Submission Status: This report provides information on which students have submitted an Exercise. |
 |
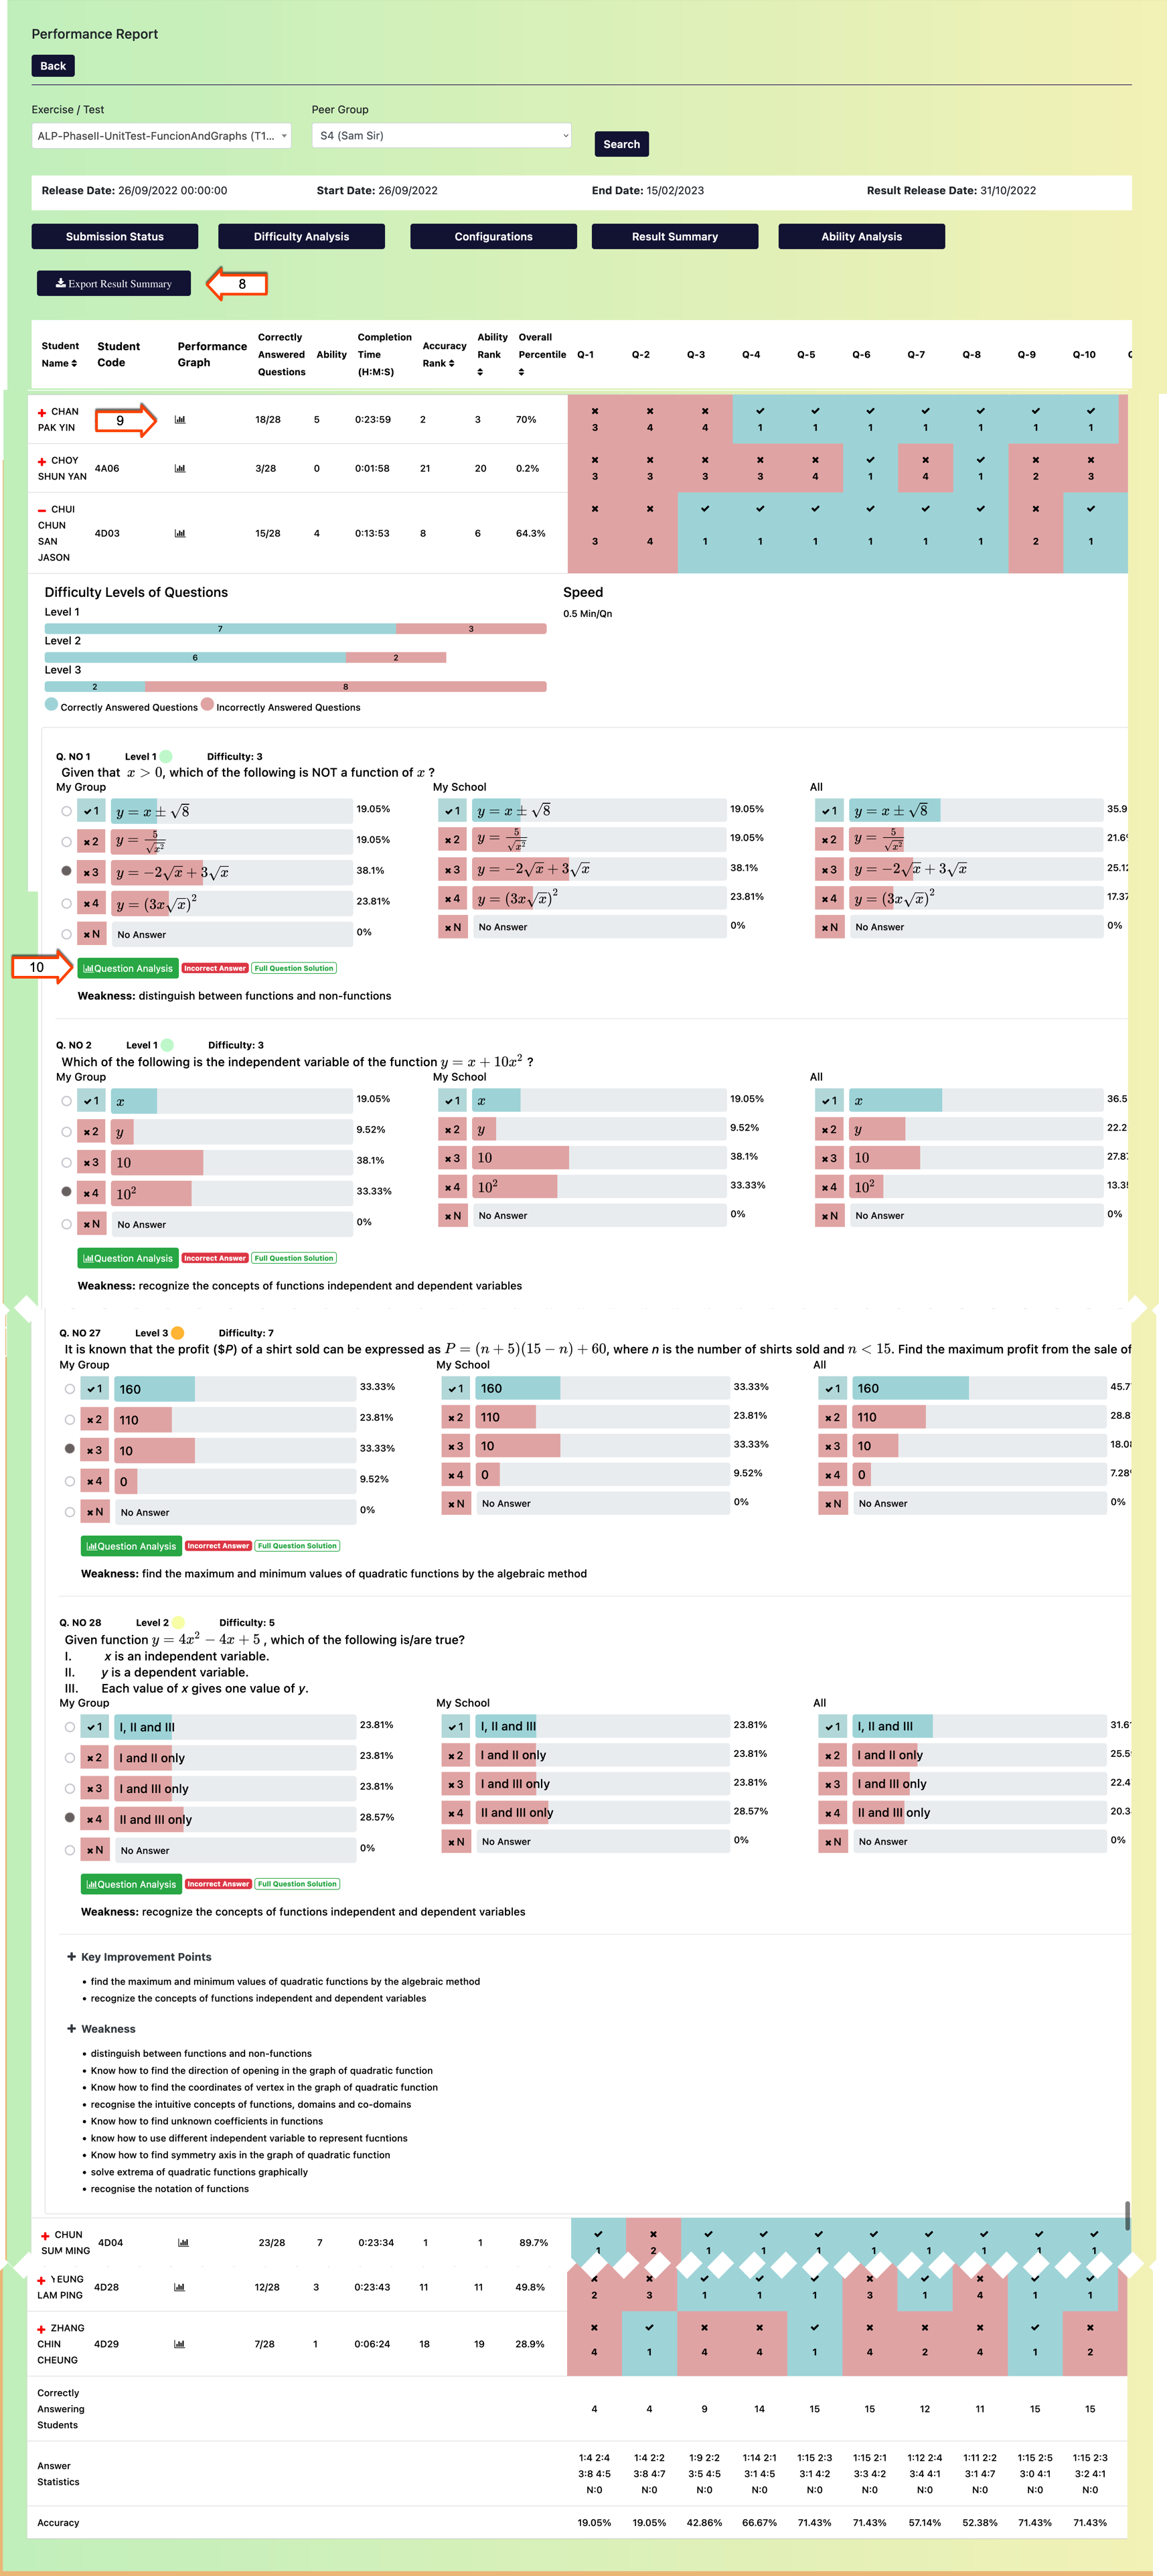
| 2 | Performance Report: This comprehensive report offers detailed information on a specific Exercise. |
 |
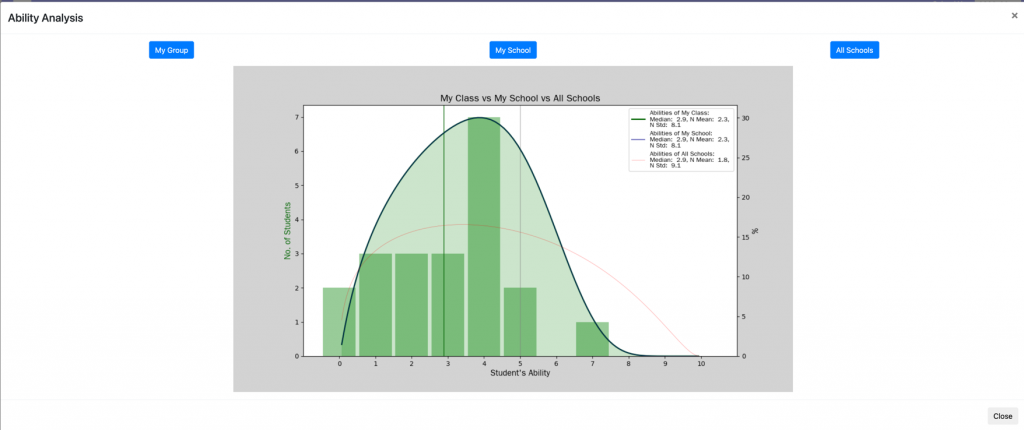
| 3 | Ability Analysis: The Ability Analysis generates a graph of students’ estimated abilities from an Exercise against the corresponding number of students. This report offers three types of analysis: analysis of students within the same Class or Peer Group, analysis of students within the same school, and analysis of students across all participating schools. |
 |
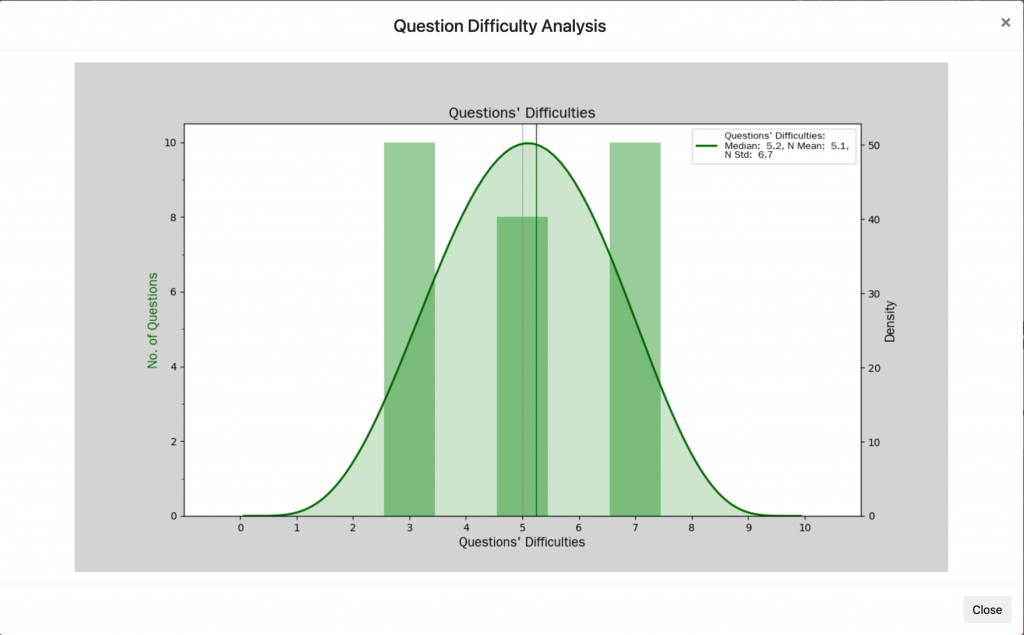
| 4 | Difficulty Analysis: The Difficulty Analysis provides a visual representation of the difficulty levels of questions in an Exercise and the corresponding number of questions for each difficulty range. |
 |
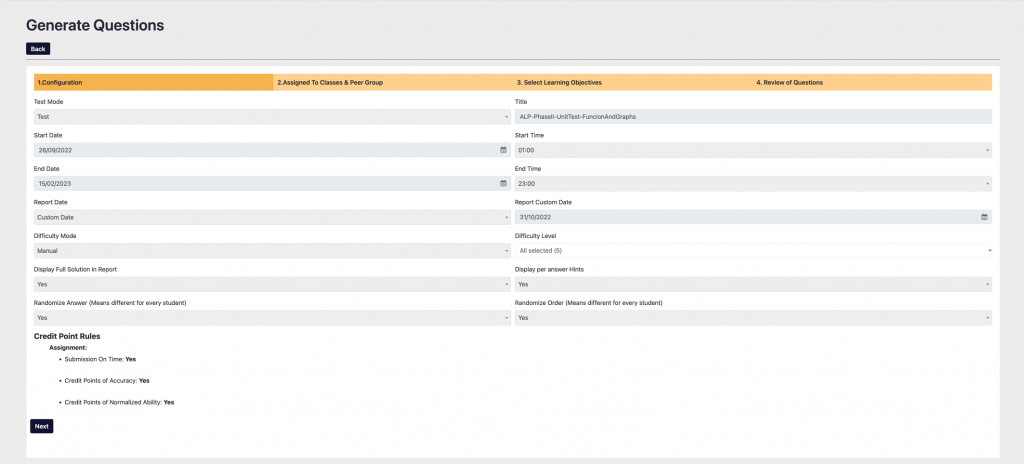
| 5 | Configurations The Configurations section provides a comprehensive overview of the settings and configurations of an Exercise, enabling users to gain a more in-depth understanding of its structure and setup. |
 |
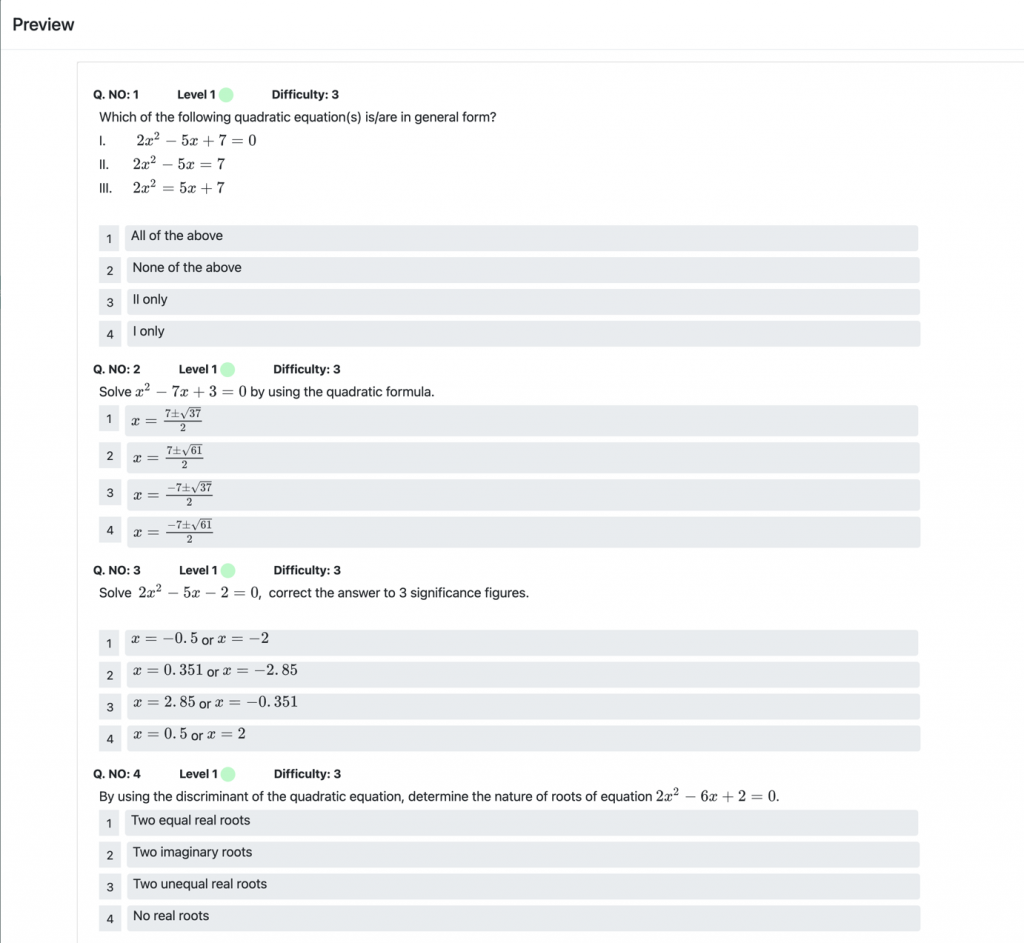
| 6 | Preview The Preview feature enables users to review all the multiple-choice questions included in an Exercise, providing a better understanding of its content. |
 |
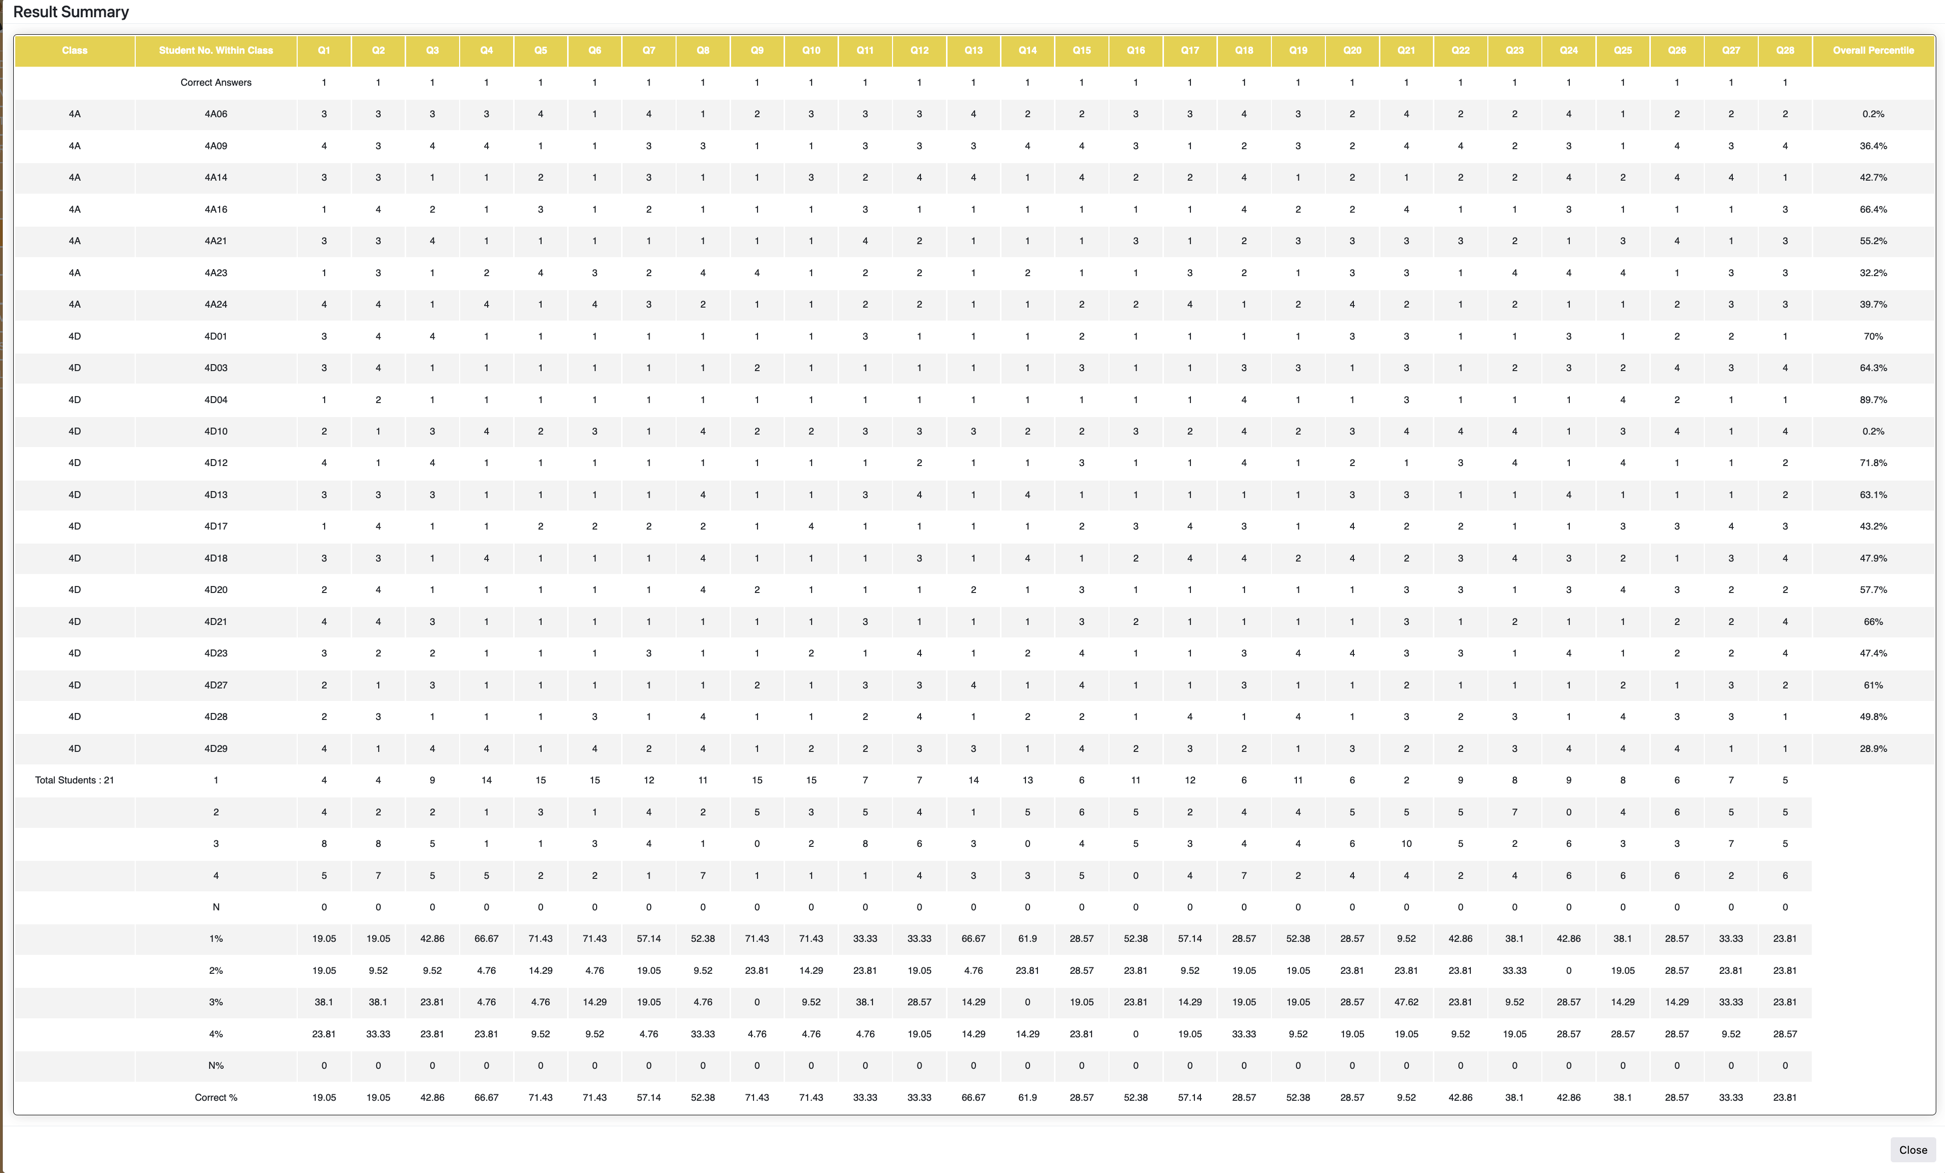
| 7 | Result Summary: The Result Summary provides a tabular format of the performance data for all questions in an Exercsie, summarizing students’ answers, correctness, and other relevant metrics. |
 |
| 8 | Export Result Summary: This feature allows users to export the data from the Result Summary table for further analysis. |
|
| 9 | Performance Graph: The Performance Graph visually represents a student’s performance in an Exercise by analyzing the number of correct (+ value) and incorrect(- value) answers in relation to the difficulty value of the questions. |
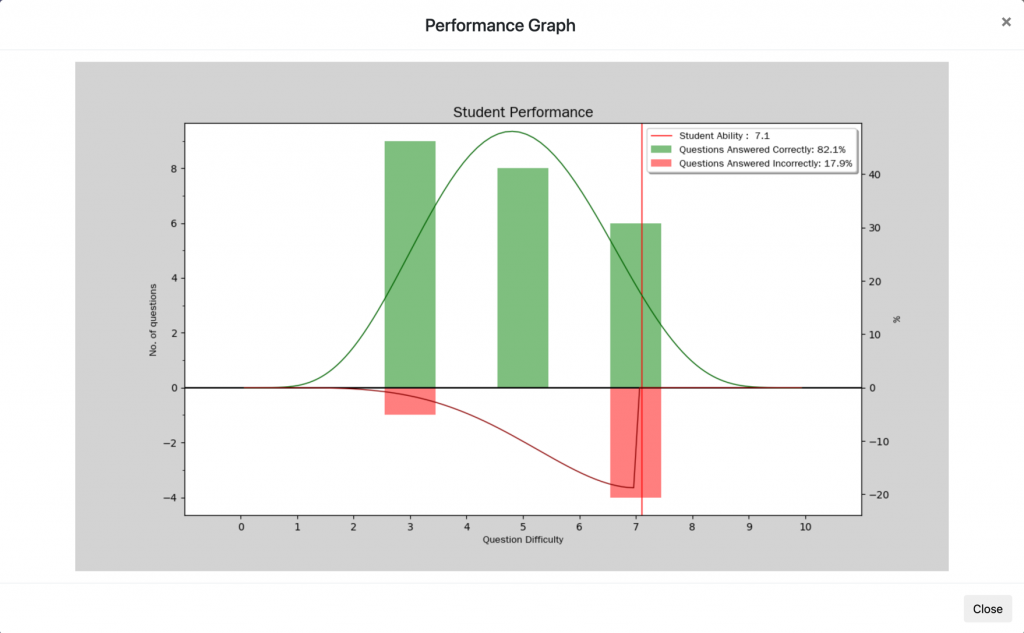 |
| 10 | Question Analysis: The Question Analysis feature displays the estimated abilities distribution of students who answered a question correctly or incorrectly. This report offers valuable insights into how students of different abilities respond to the question. |
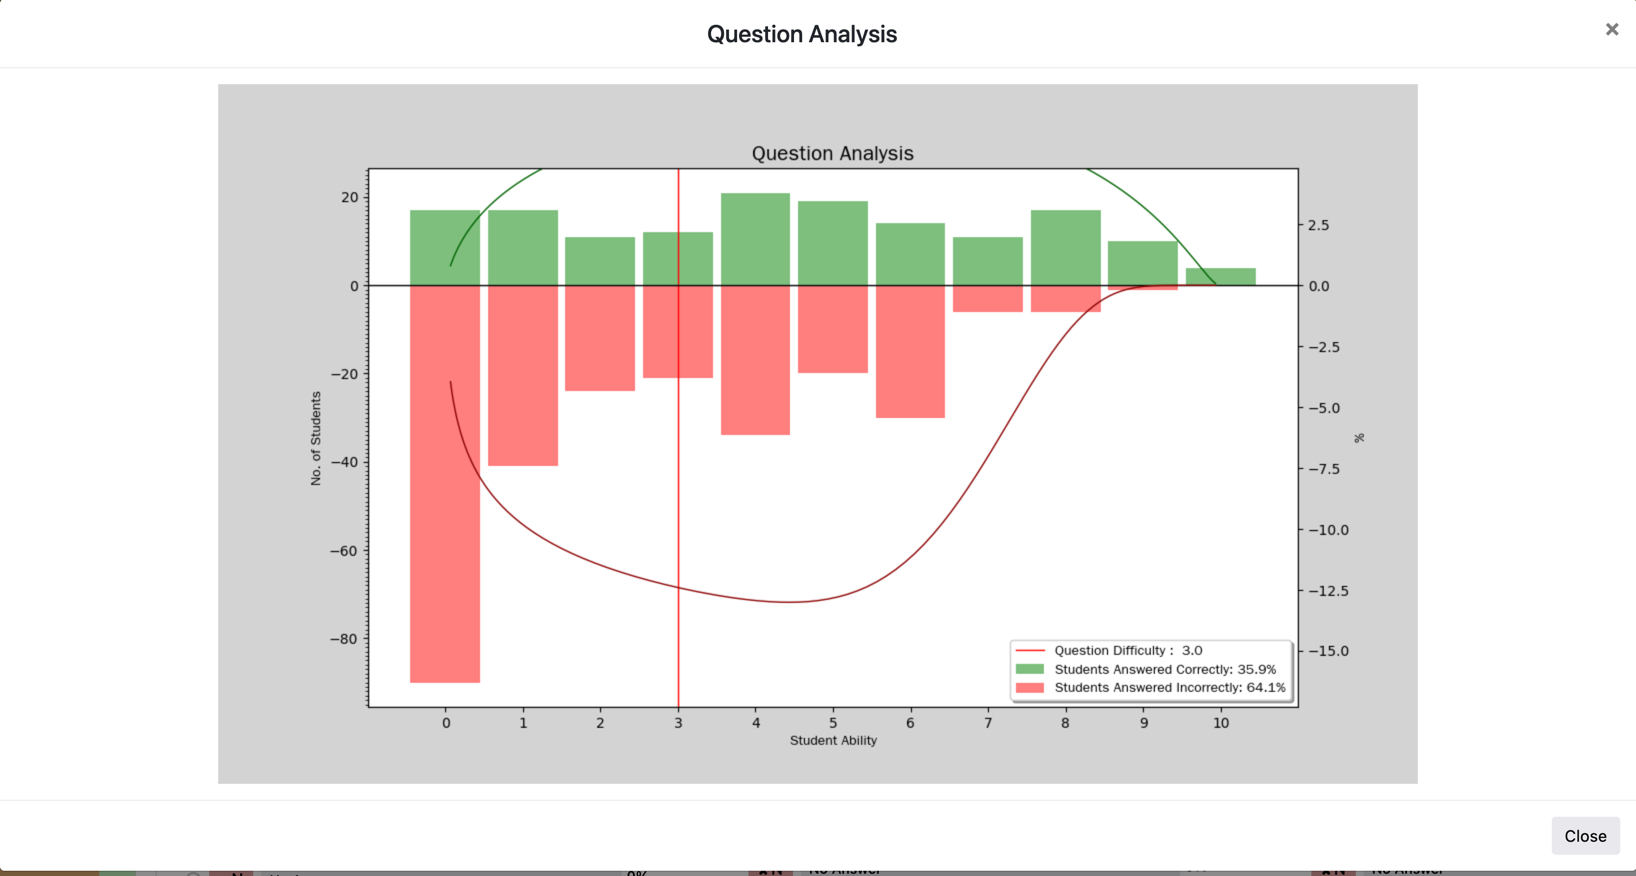 |