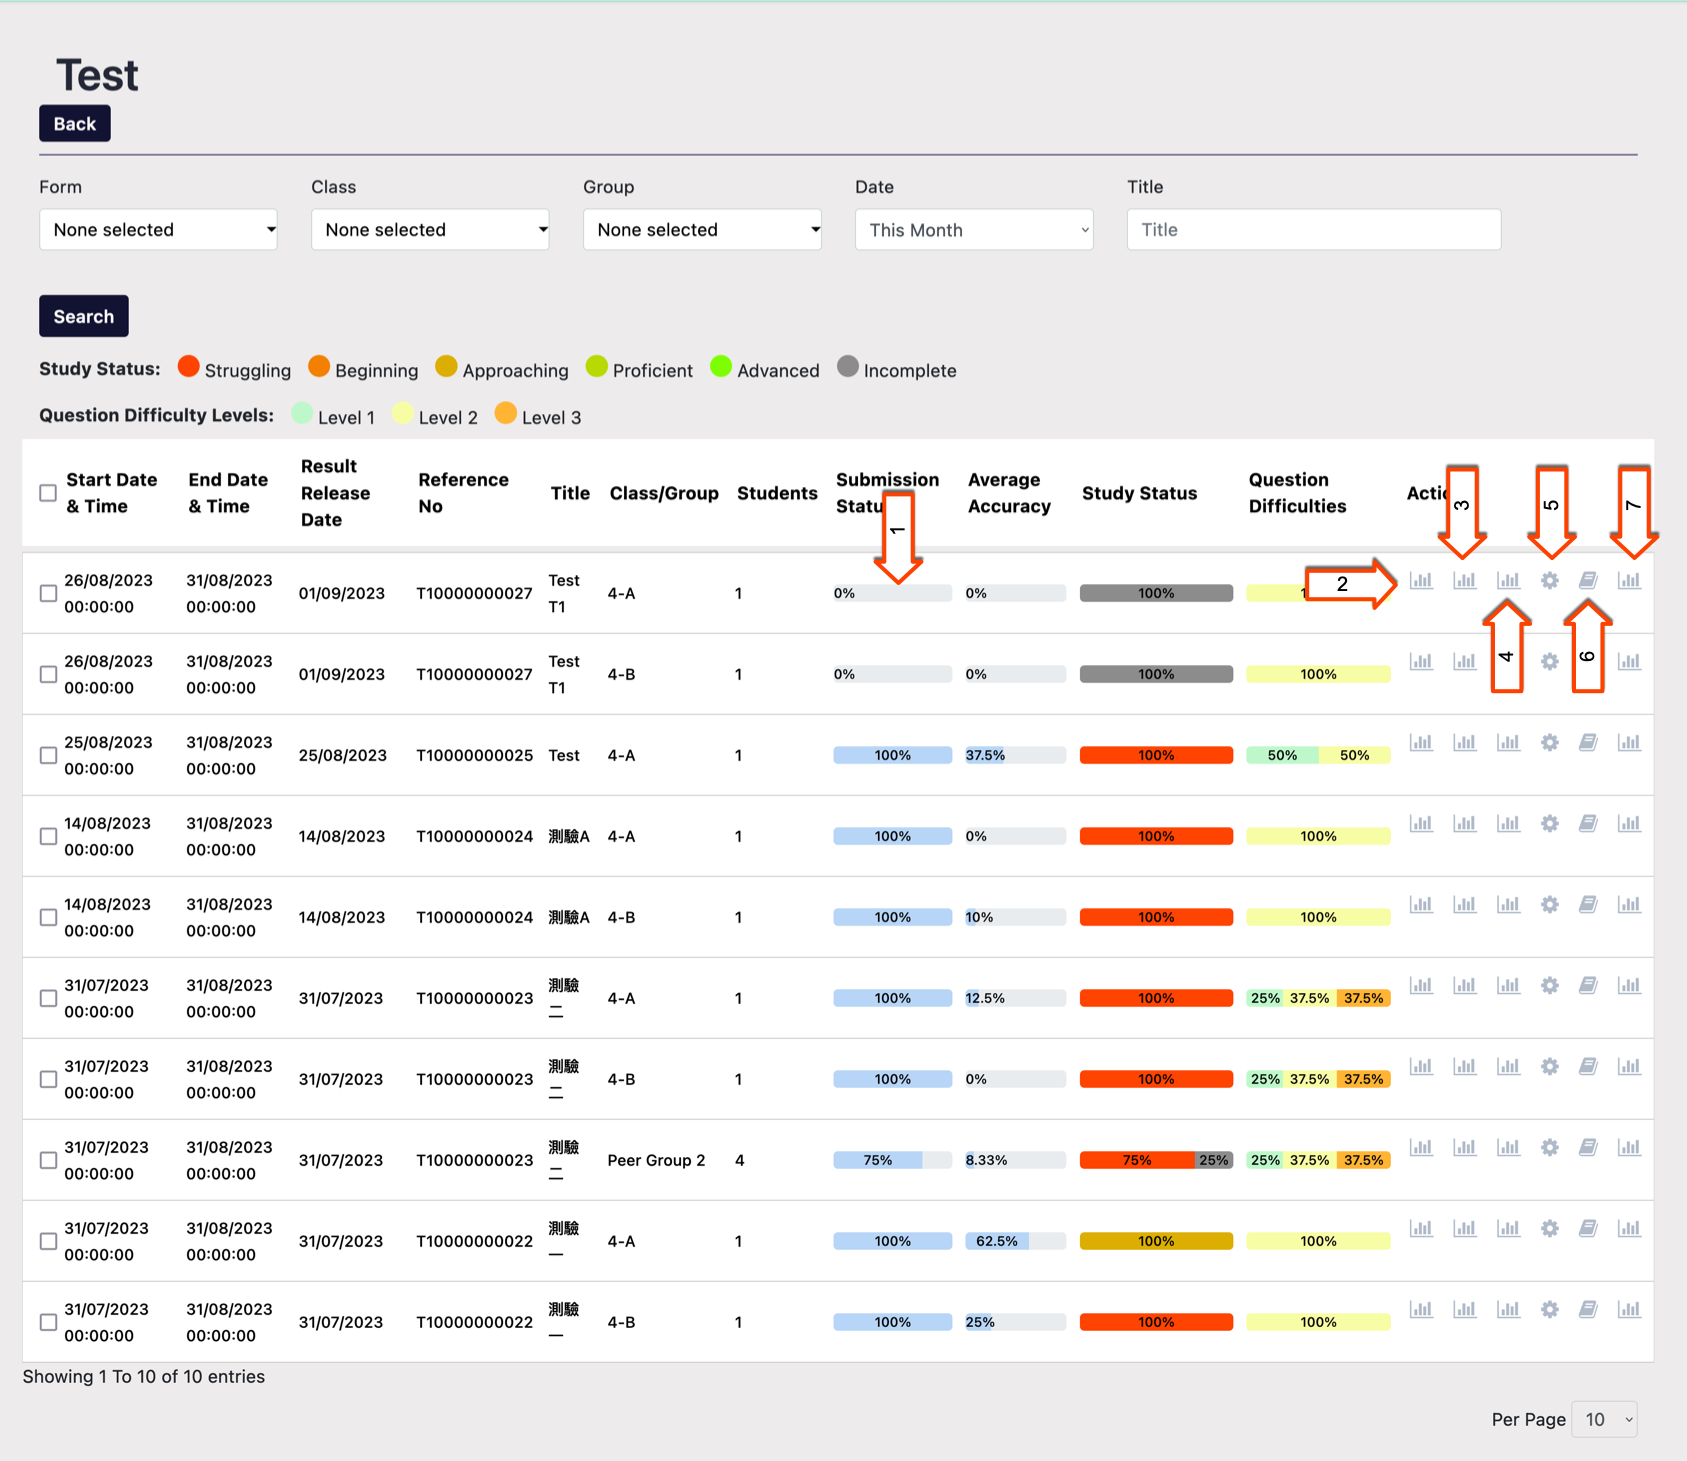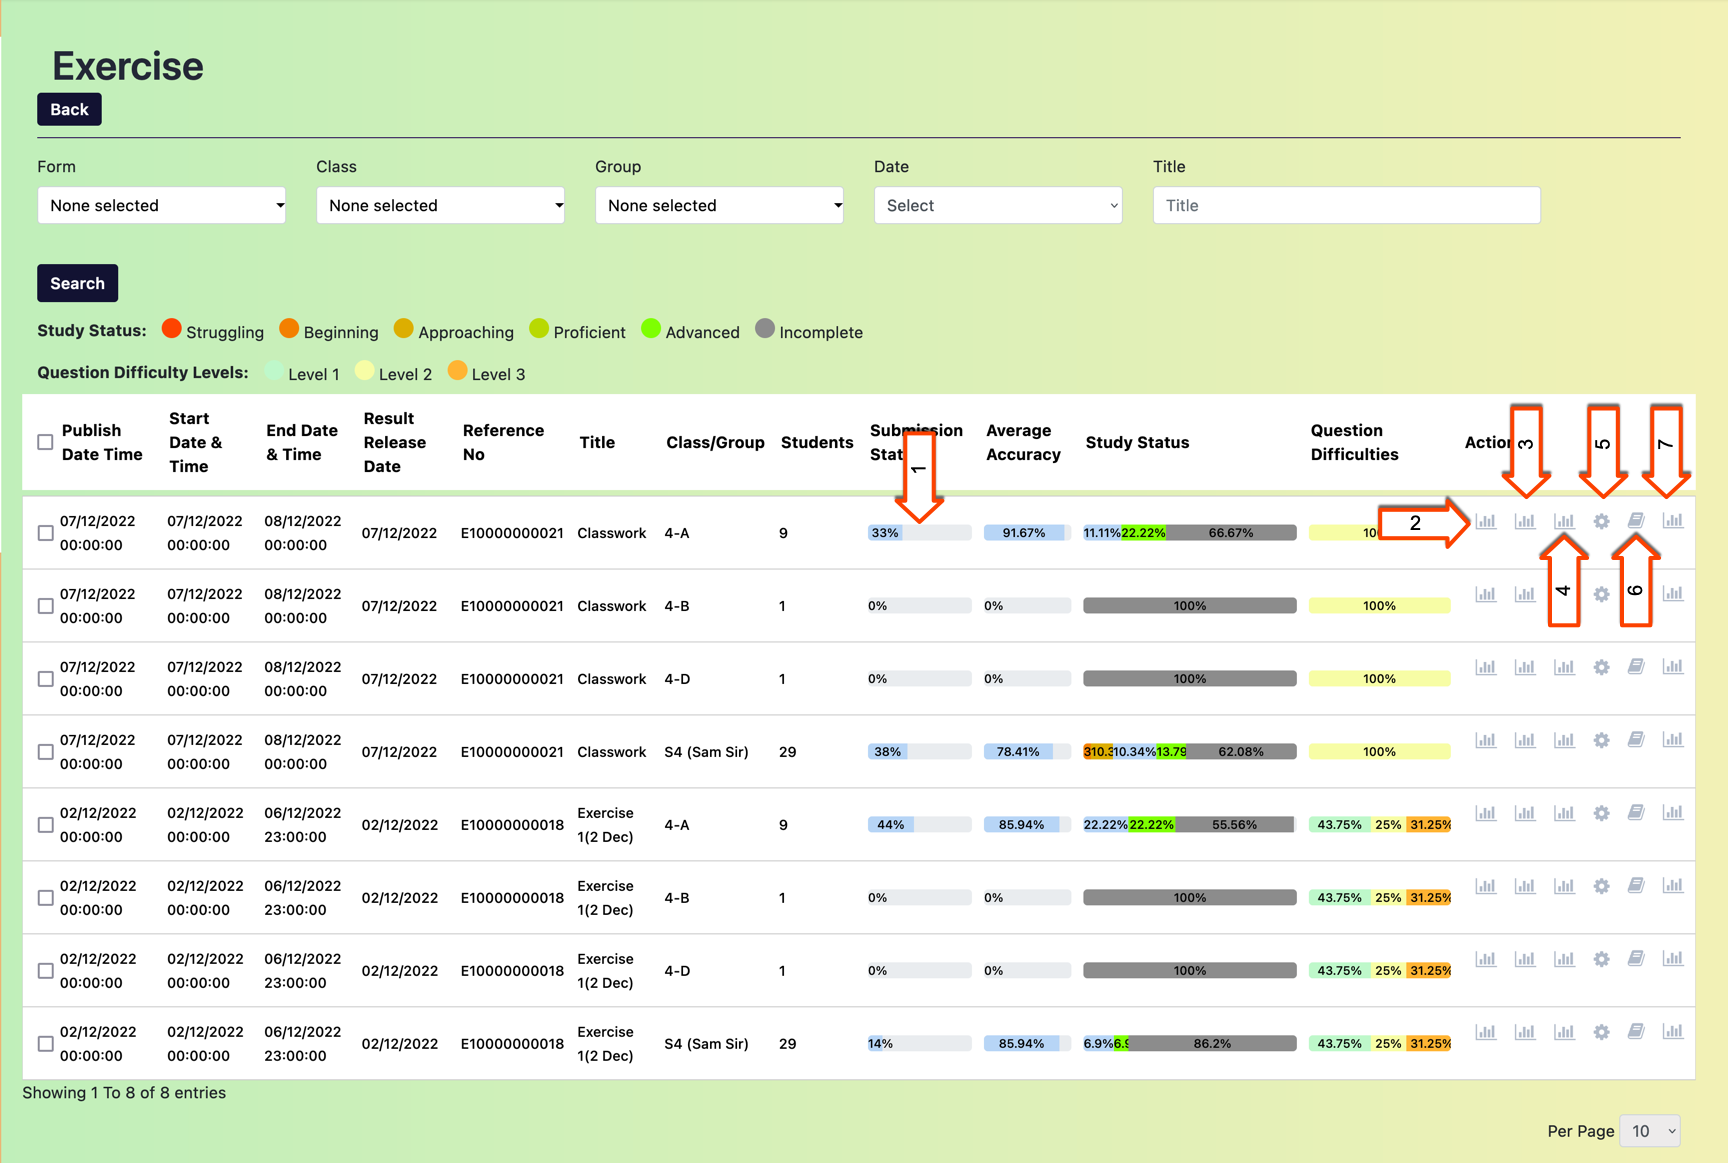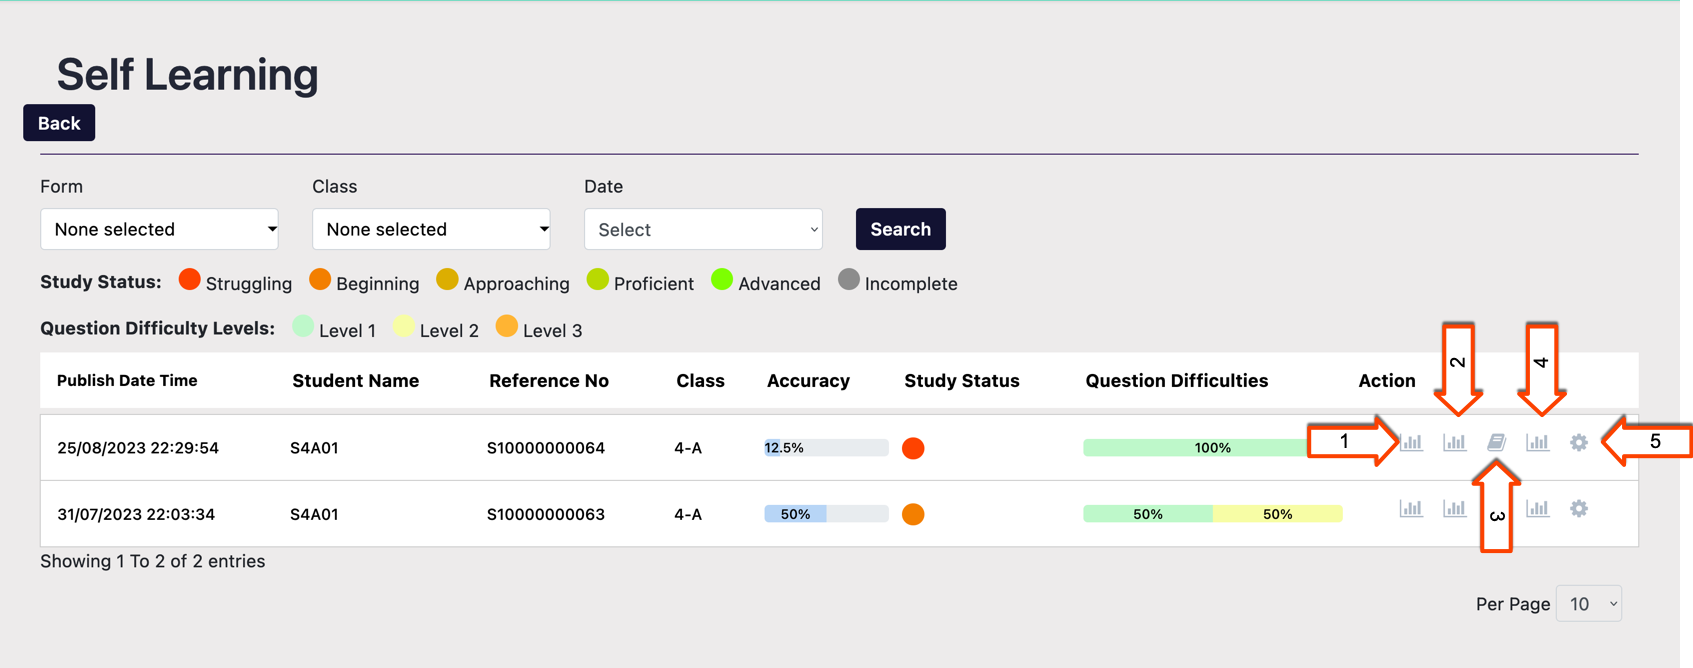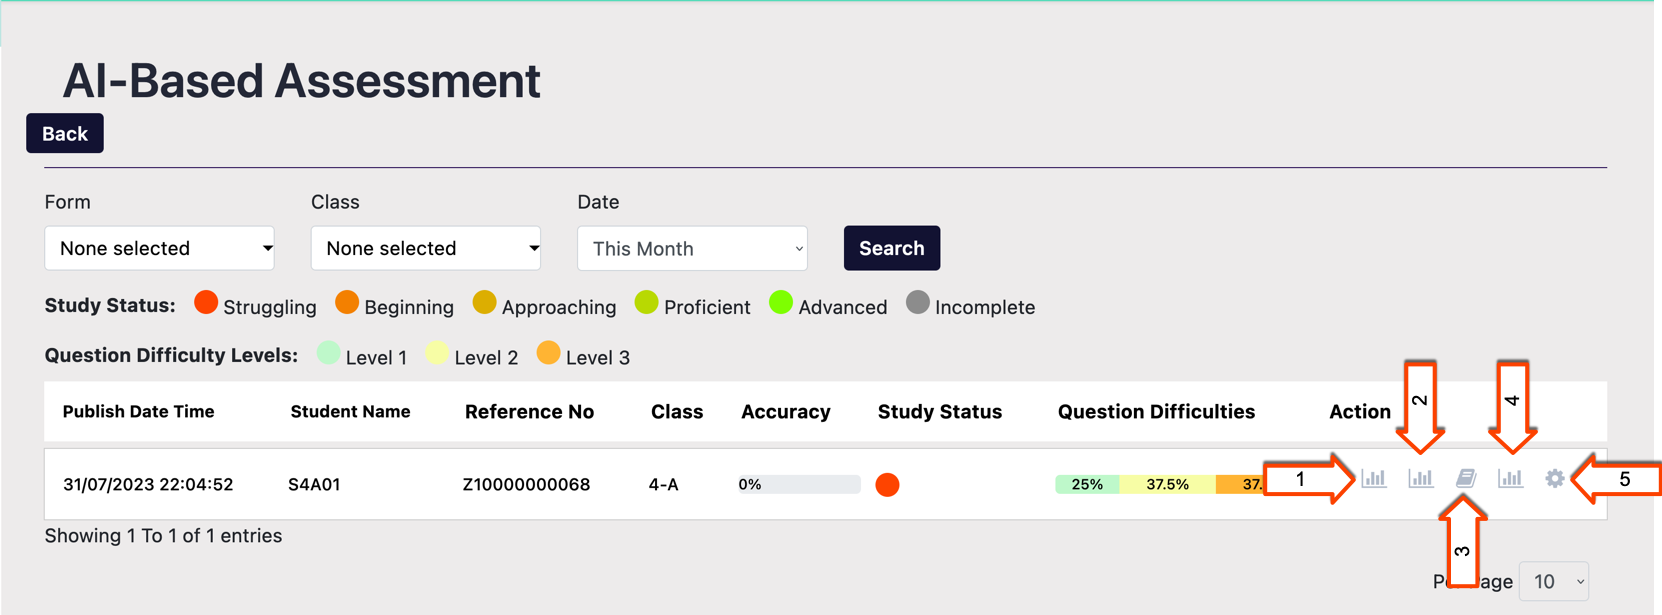
In this section of the platform, users can access a comprehensive suite of reports for each AI-based Assessment, which offers valuable insights into student performance. The reports available include:
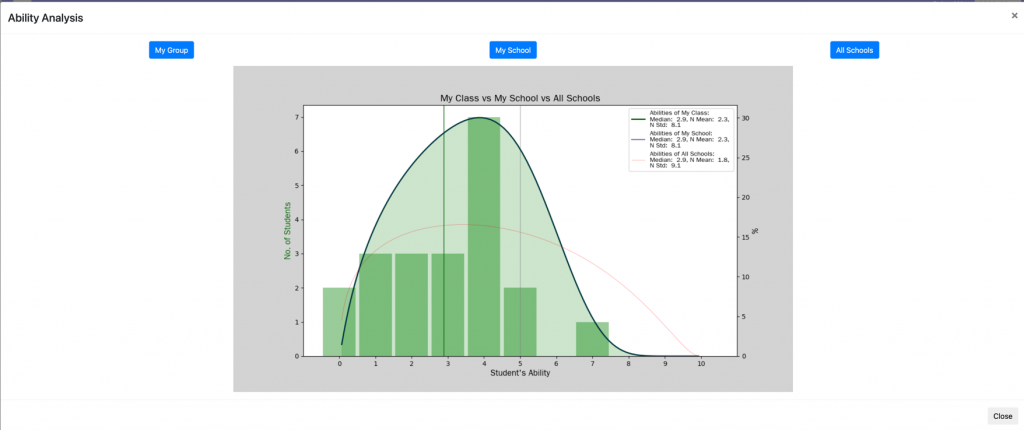
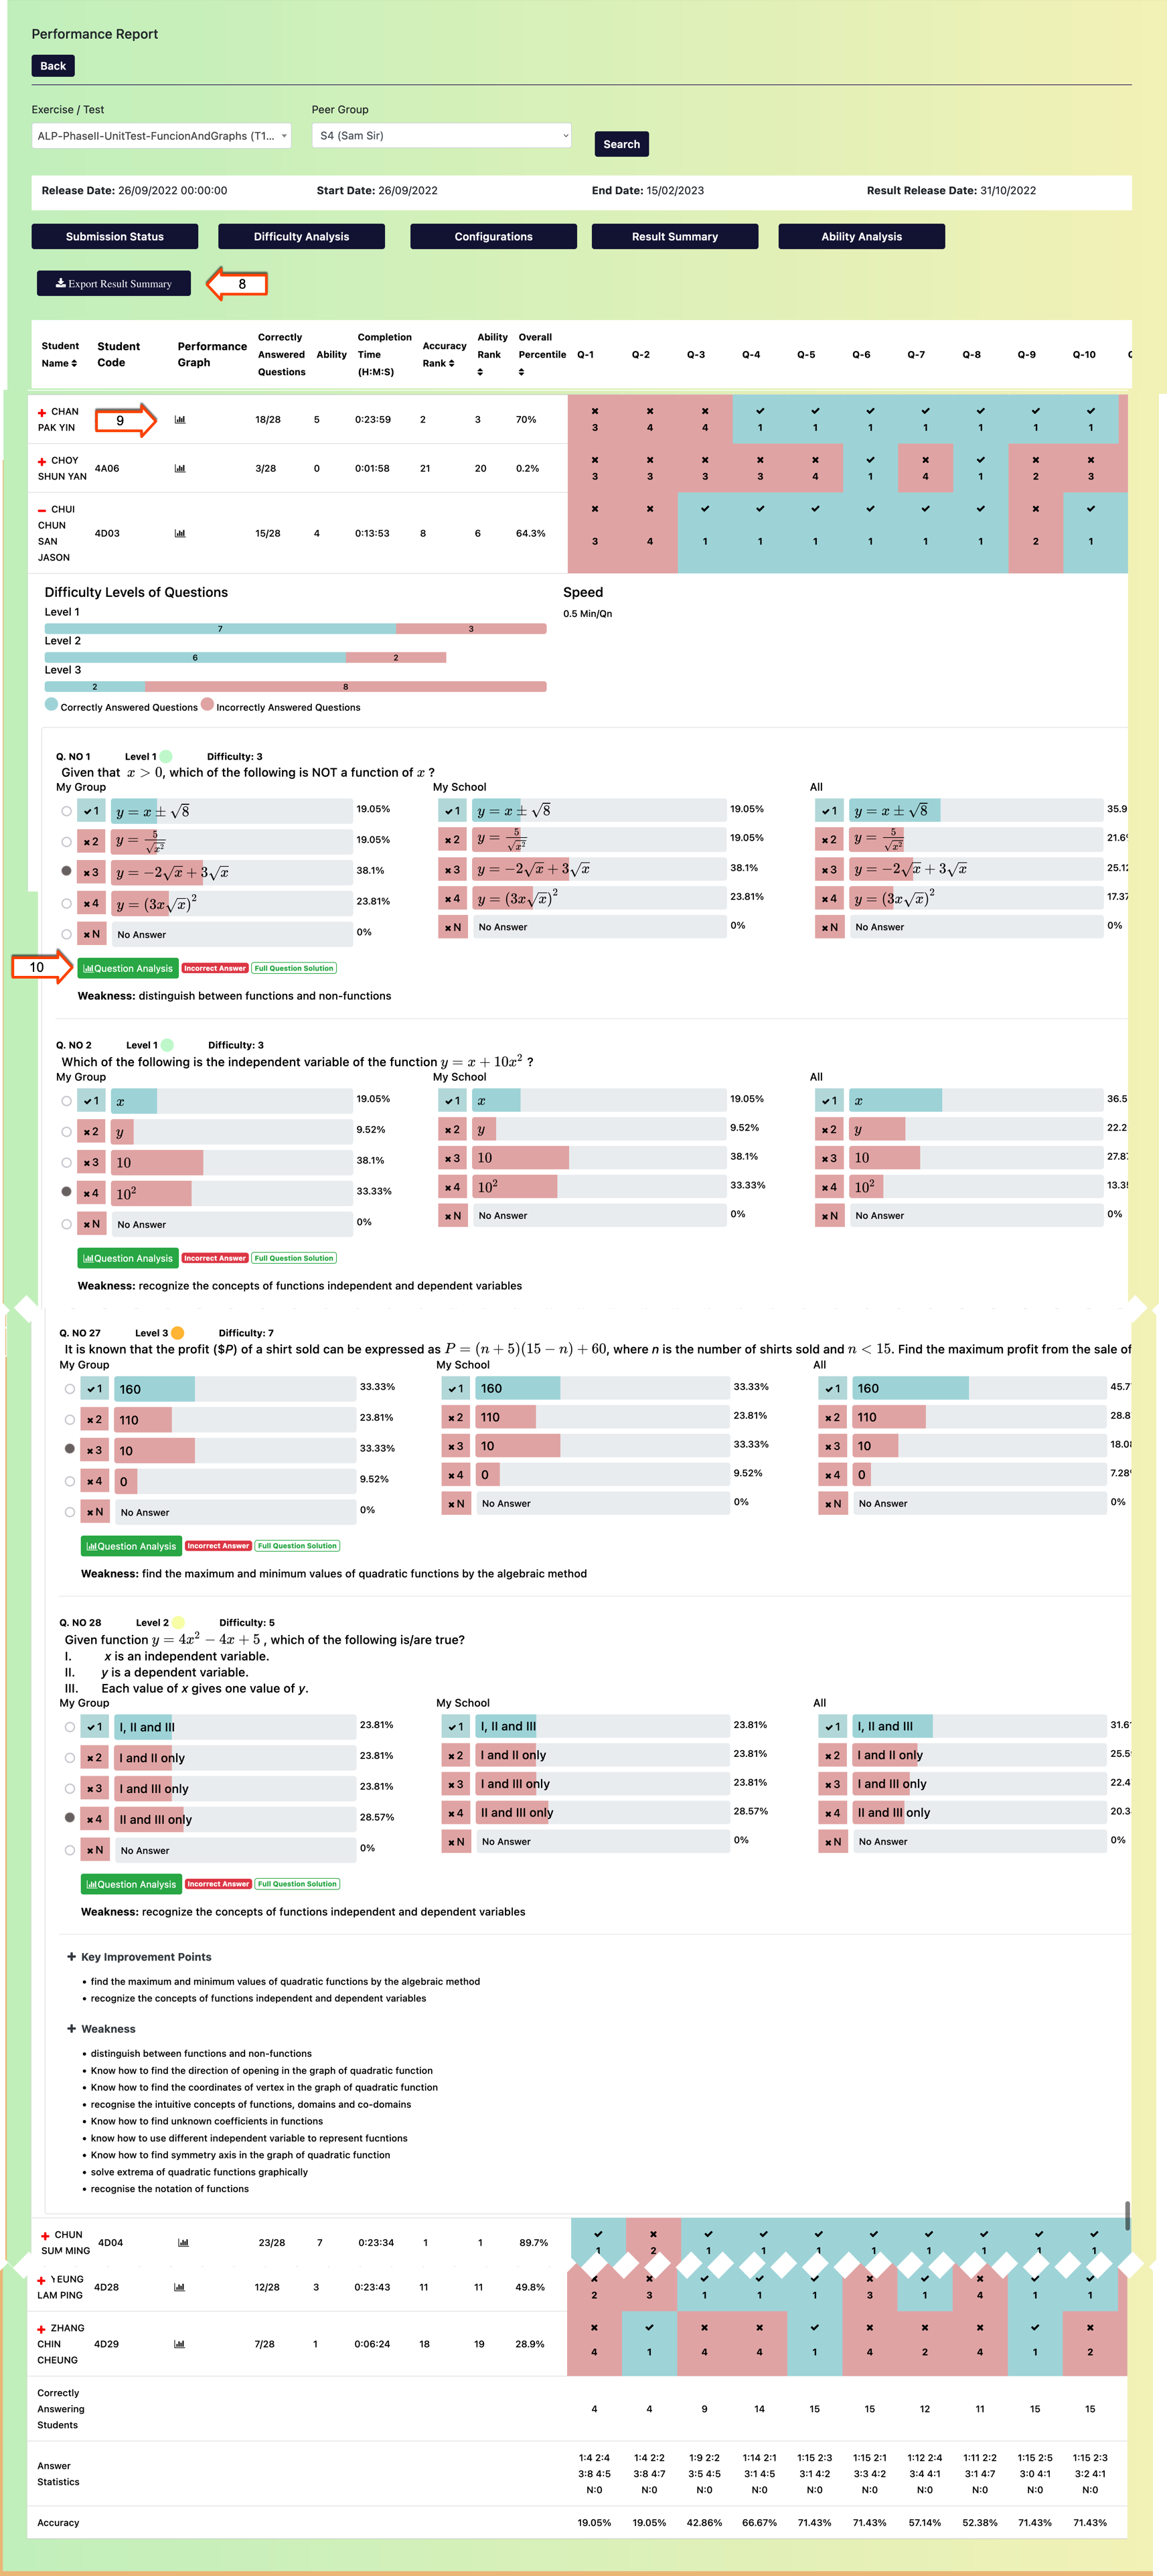
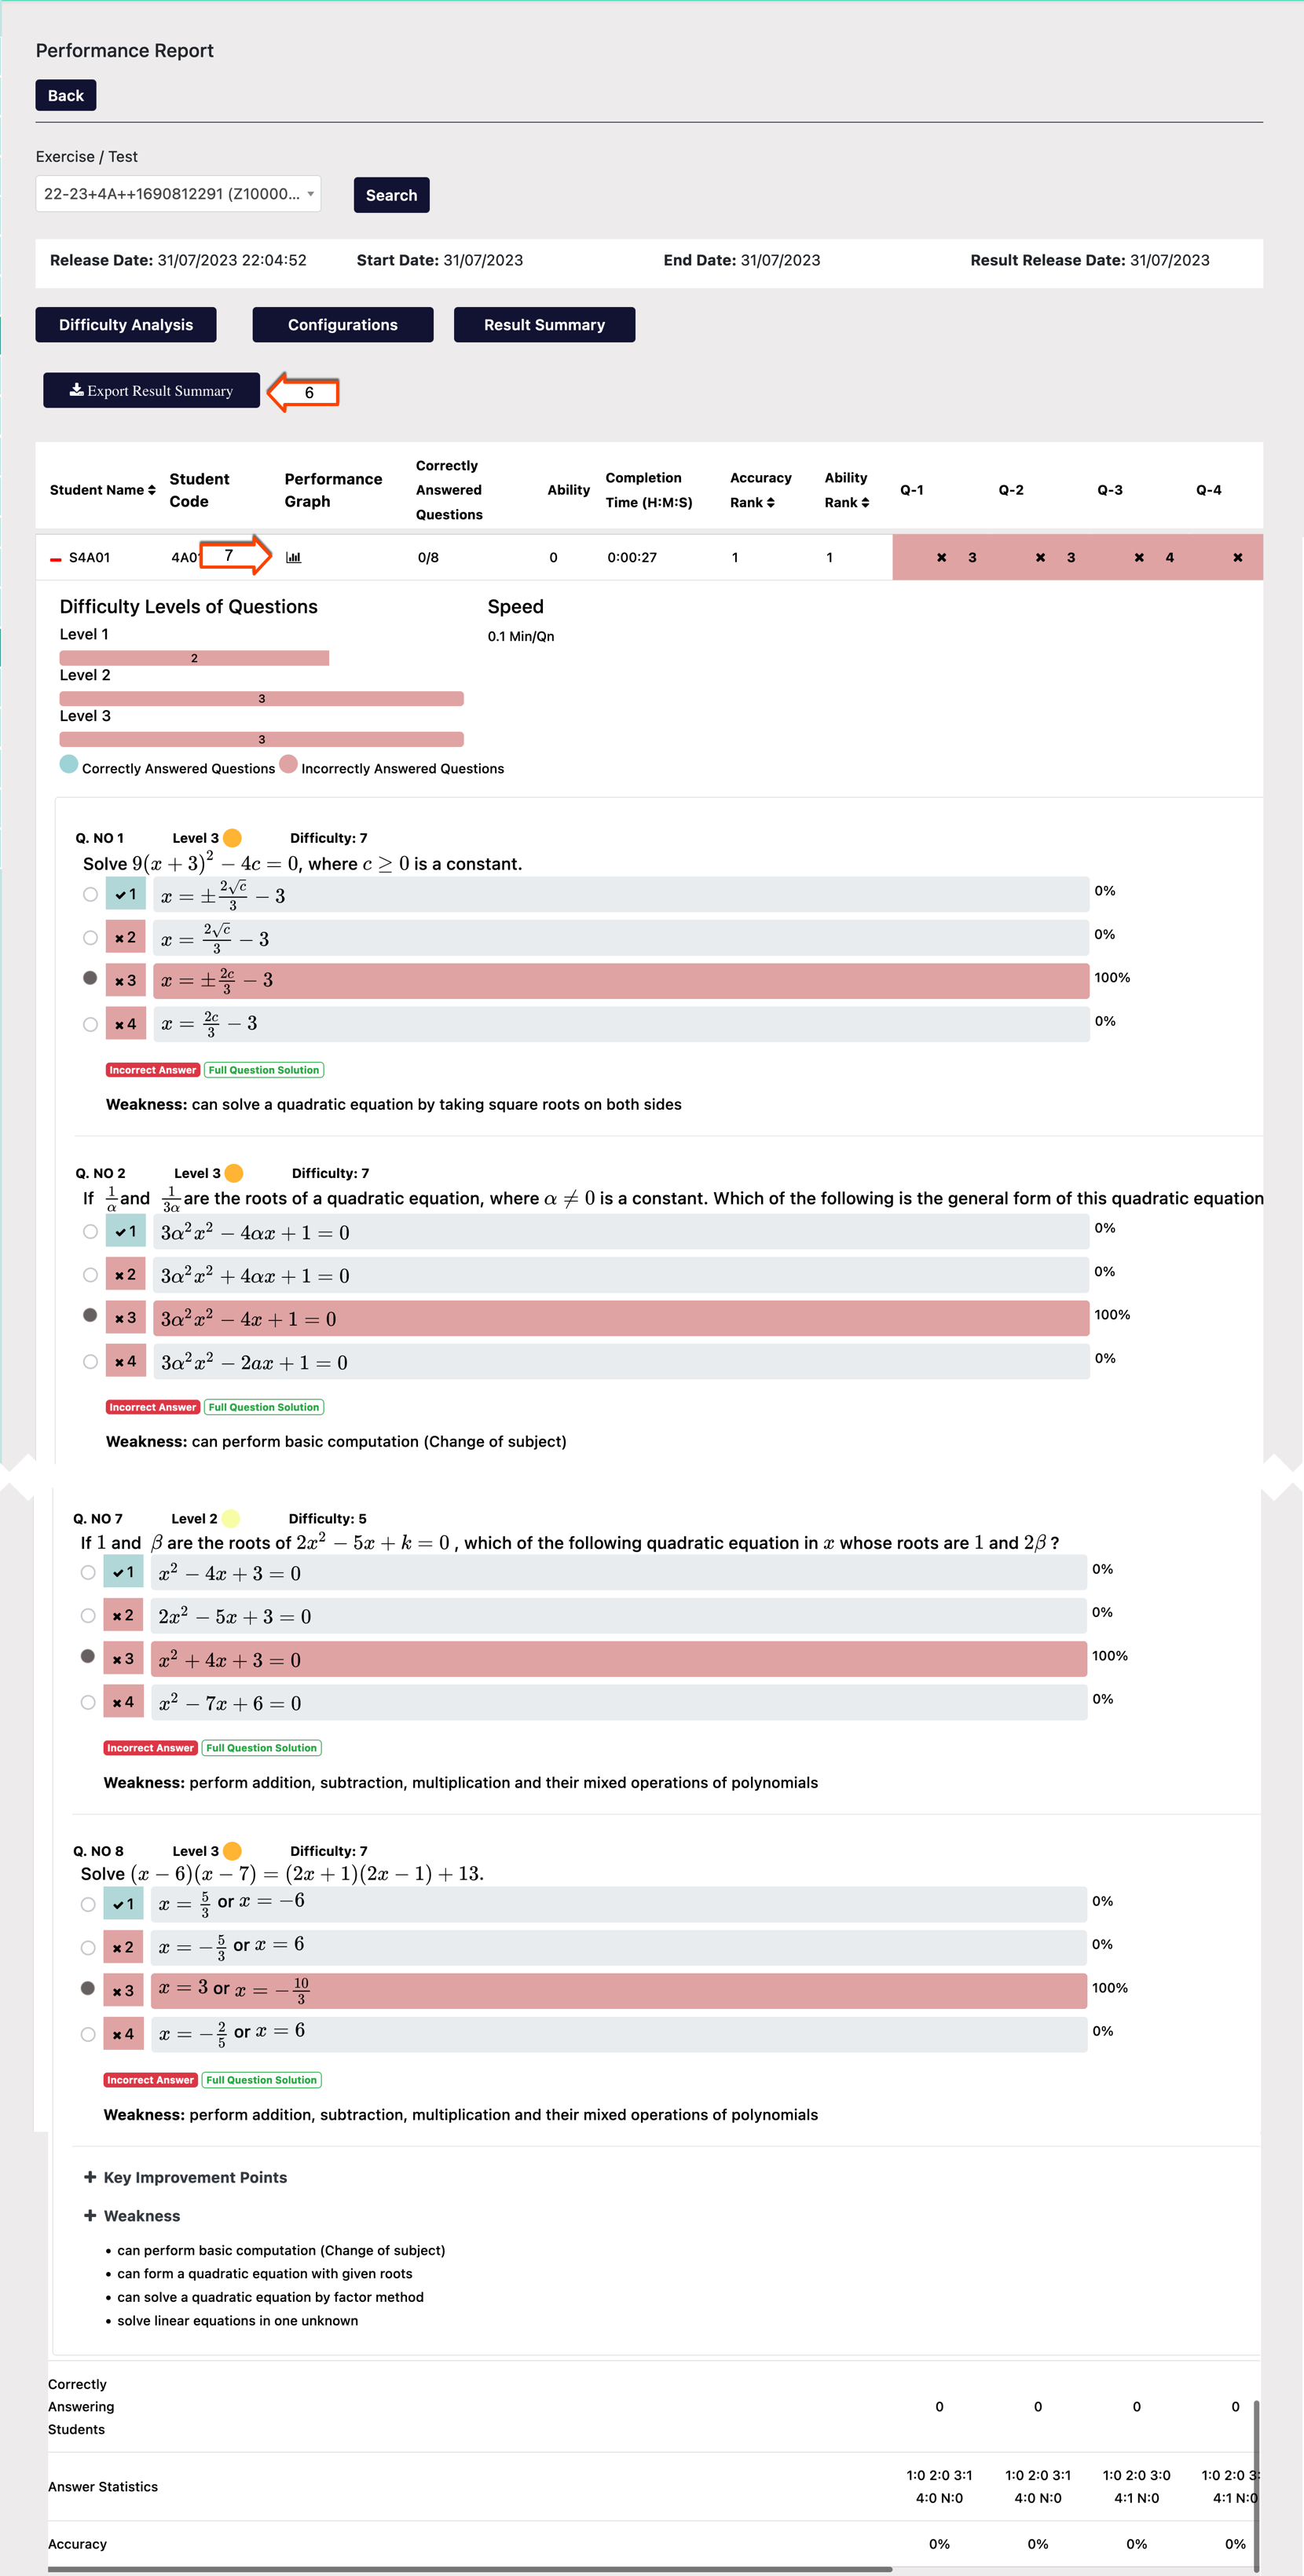
1. Performance Report:
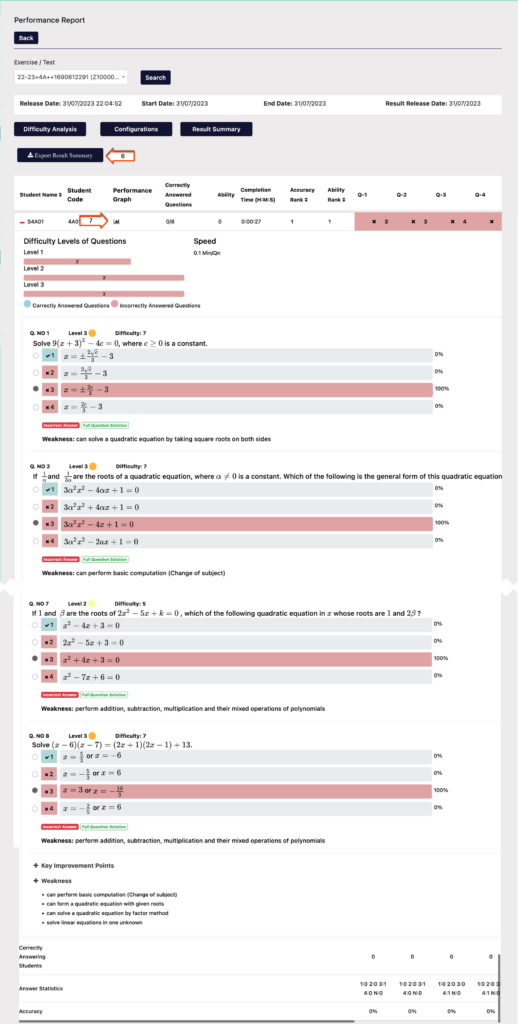
This detailed report provides a comprehensive overview of the specific AI-based Assessment, including detailed insights into the student’s performance, enabling users to identify areas where students excel and areas that require improvement.
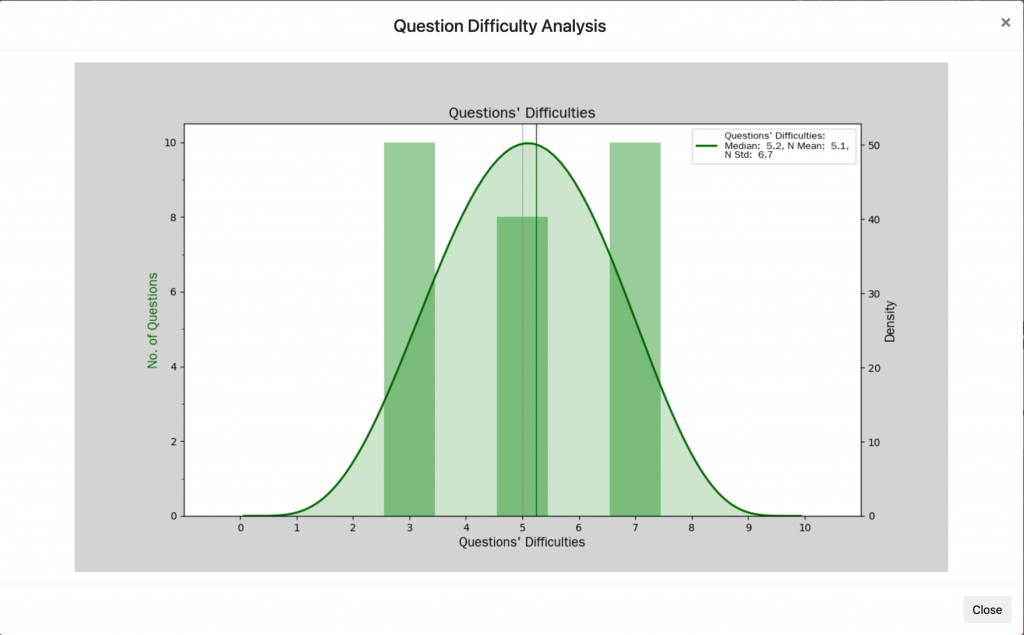
2. Difficulty Analysis:
The Difficulty Analysis presents users with a visual representation of the difficulty levels of questions in the AI-based Assessment, along with the corresponding number of questions for each difficulty level. This report helps users understand the level of difficulty of the exercise and identify areas where students may struggle.

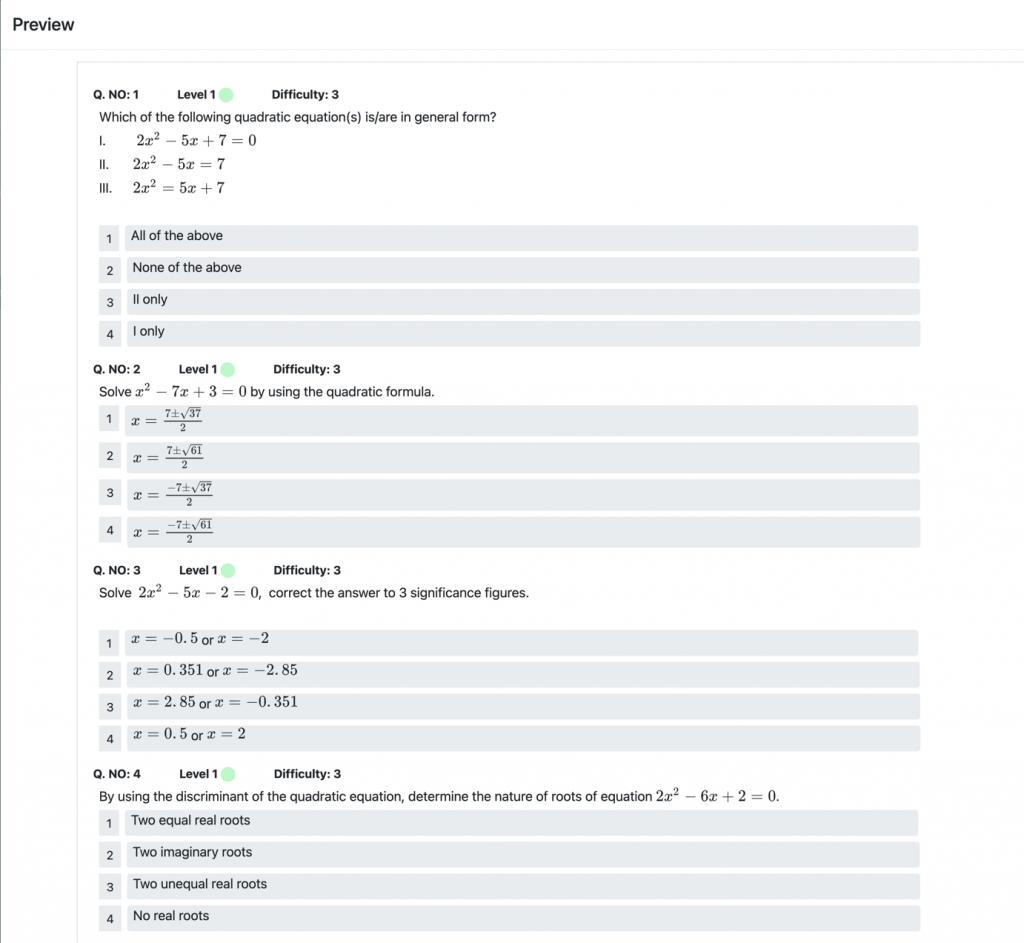
3. Preview:
The Preview feature enables users to review all the multiple-choice questions included in the AI-based Assessment, providing a better understanding of its content.

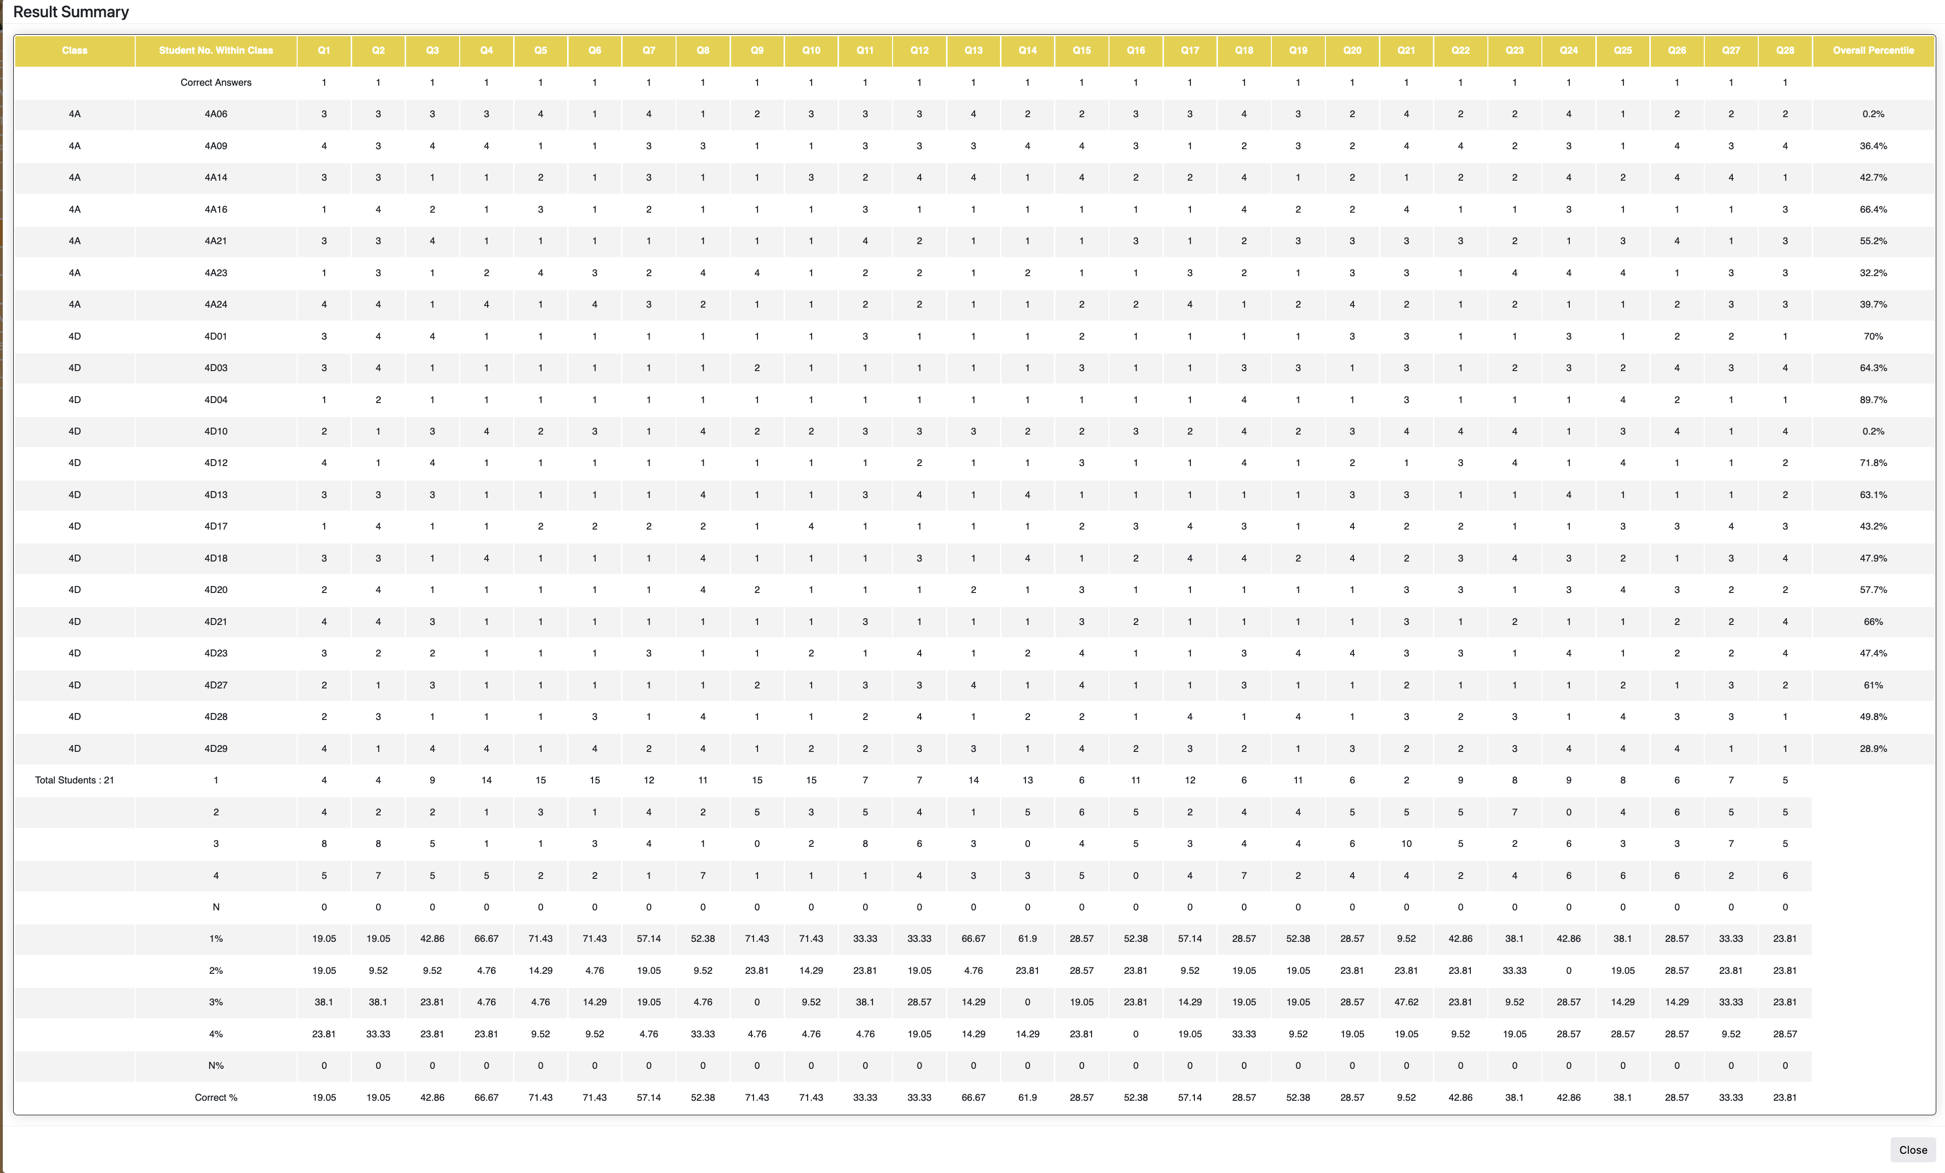
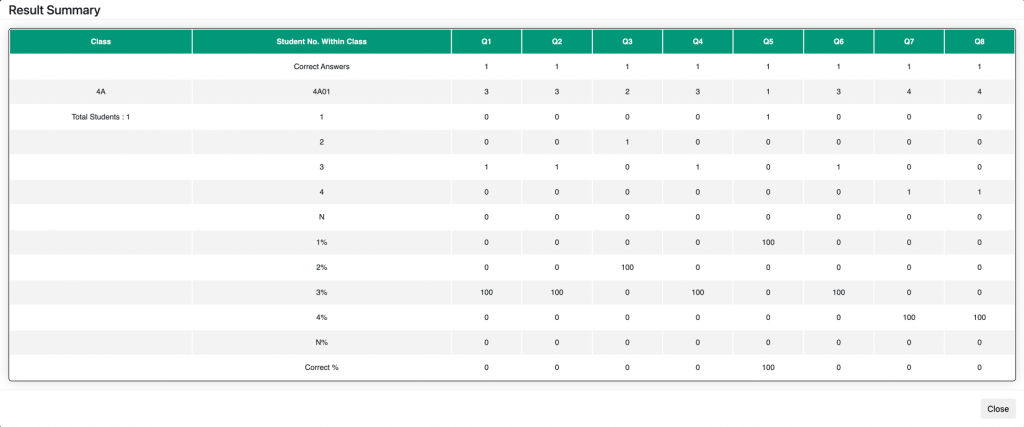
4. Result Summary:
The Result Summary provides a tabular format of the performance data for all questions in the AI-based Assessment, summarizing students’ answers, correctness, and other relevant metrics.

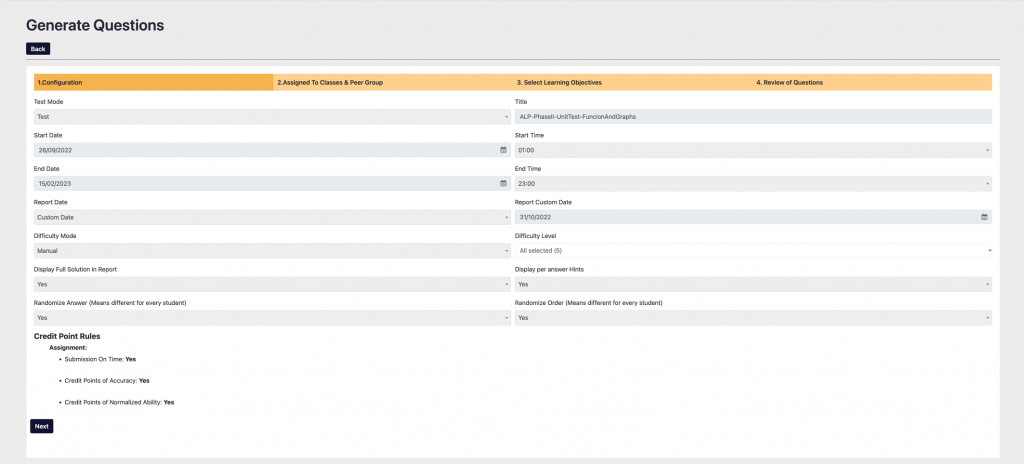
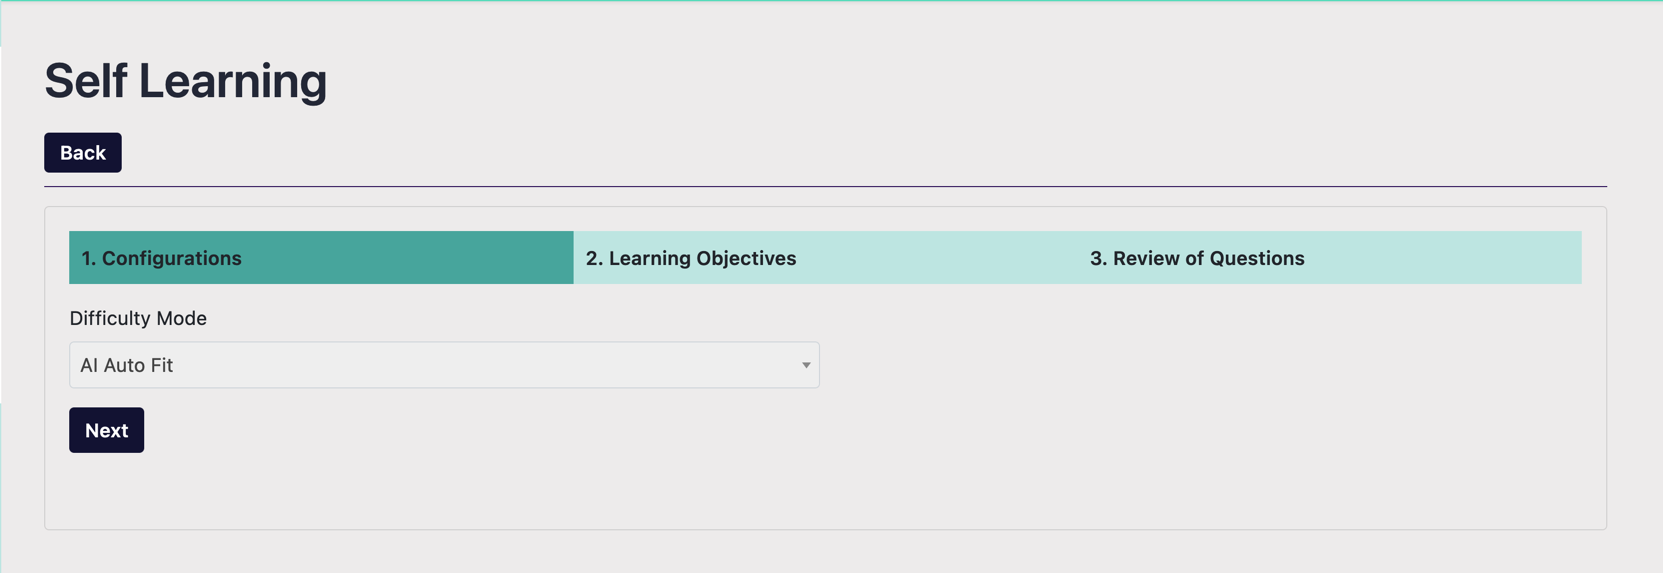
5. Configurations:
The Configurations report provides users with a detailed overview of the settings and configurations of AI-based Assessment. This valuable information allows users to gain insights into the exercise’s structure and setup, enabling them to tailor their approach to the material accordingly. Users can use this report to fine-tune their instruction and maximize student learning.

6. Export Result Summary:
This feature allows users to export the data from the Result Summary table for further analysis.
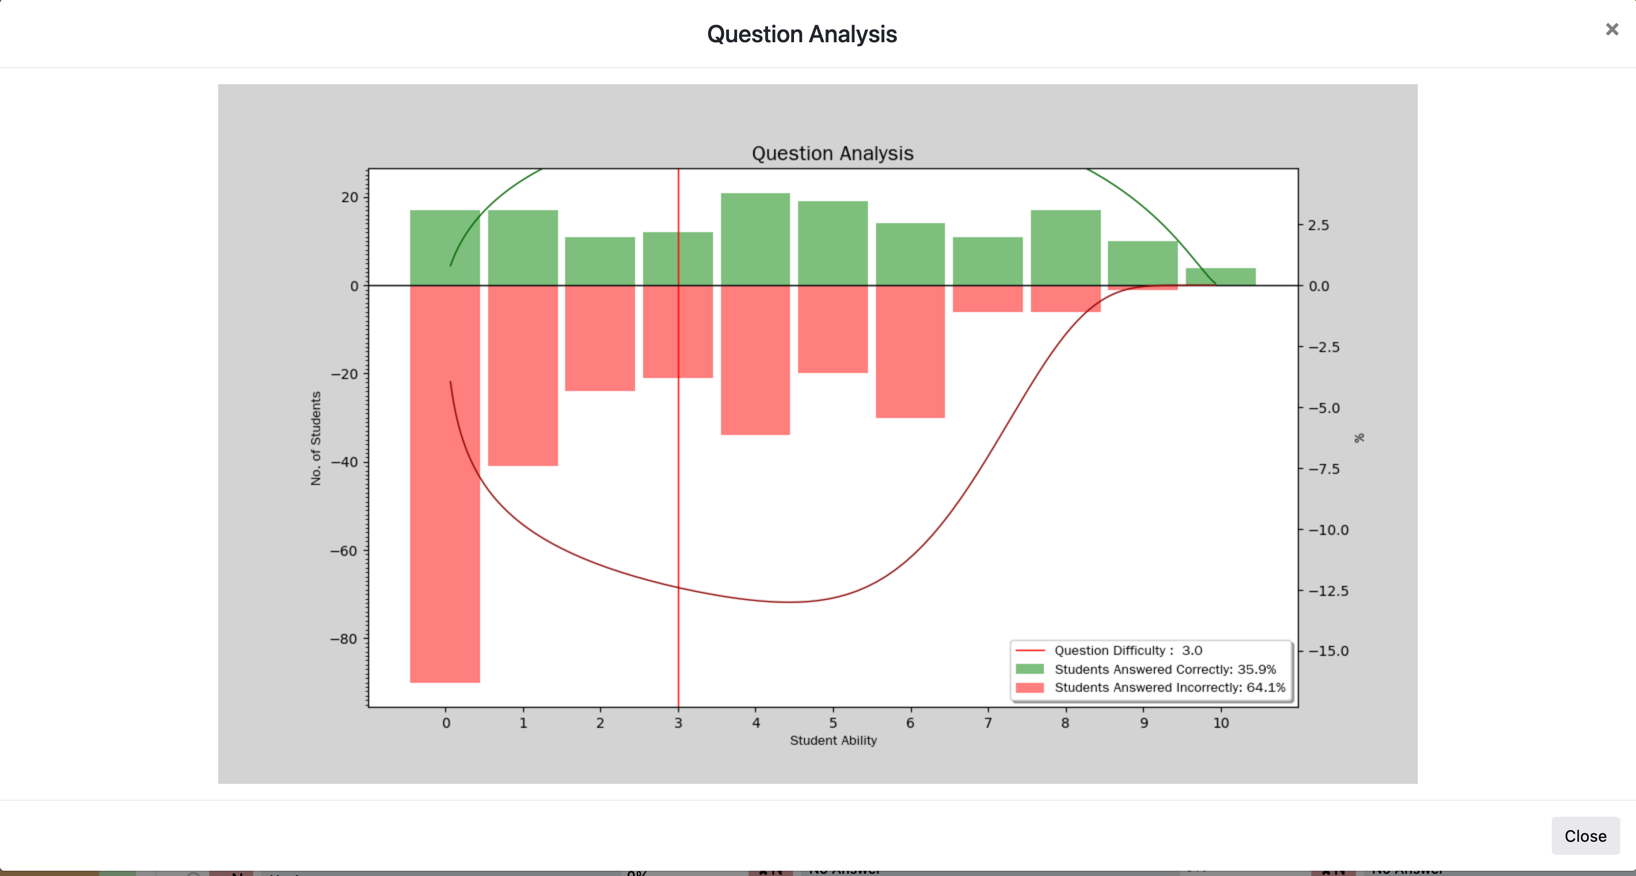
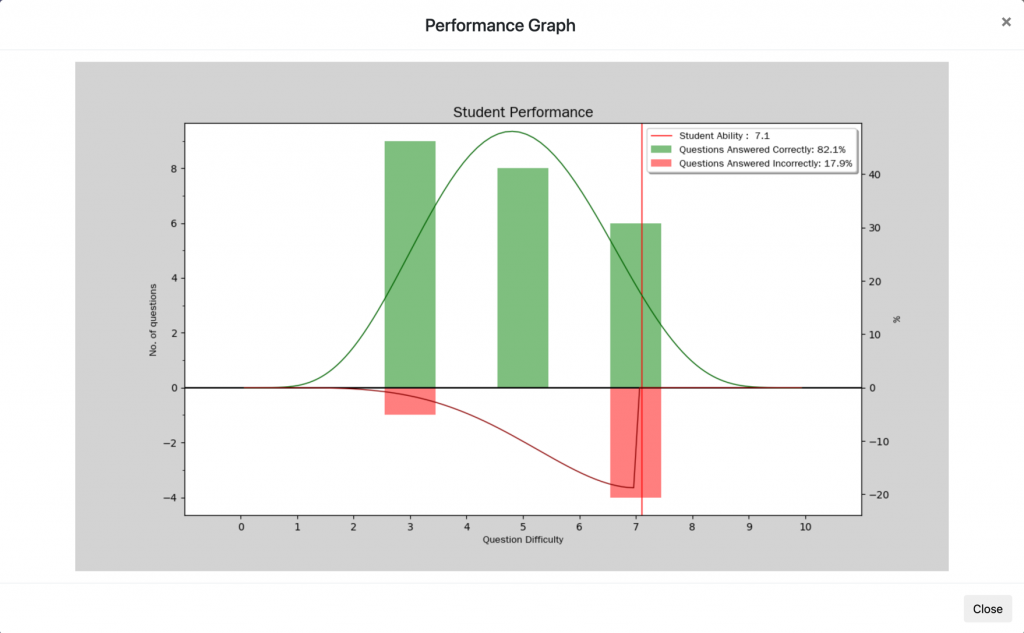
7. Performance Graph:
The Performance Graph provides users with a visual representation of a student’s performance in the AI-based Assessment, enabling them to analyze the number of correct and incorrect answers in relation to the difficulty level of the questions. This report helps users to understand the student’s overall performance and identify patterns in their answers.